
| Redzoning- All people have equal access to justice |
About this measure |
This measure provides monthly data on the use of redzoning in the Cuyahoga County Corrections Center. "Redzoning" is a term used to describe a staffing pattern utilized during times of staffing shortages. During a typical day, each housing unit, called a pod or dorm, is supervised by a corrections officer. When a staffing shortage occurs a corrections officer will be assigned to oversee two or more pods/dorms. During these times, called redzoning, inmates are locked in their pods/dorms.
This measure tracks the average number of hours redzoning is used per day as well as the average number of hours redzoning is used per day per pod/dorm capable of being locked down. Due to the layout of the jail and requirements of specific pods/dorms, not all pods/dorms use redzoning during staffing shortages. The Cuyahoga County Corrections Center is comprised of two towers, denoted here as Jail 1 and Jail 2.
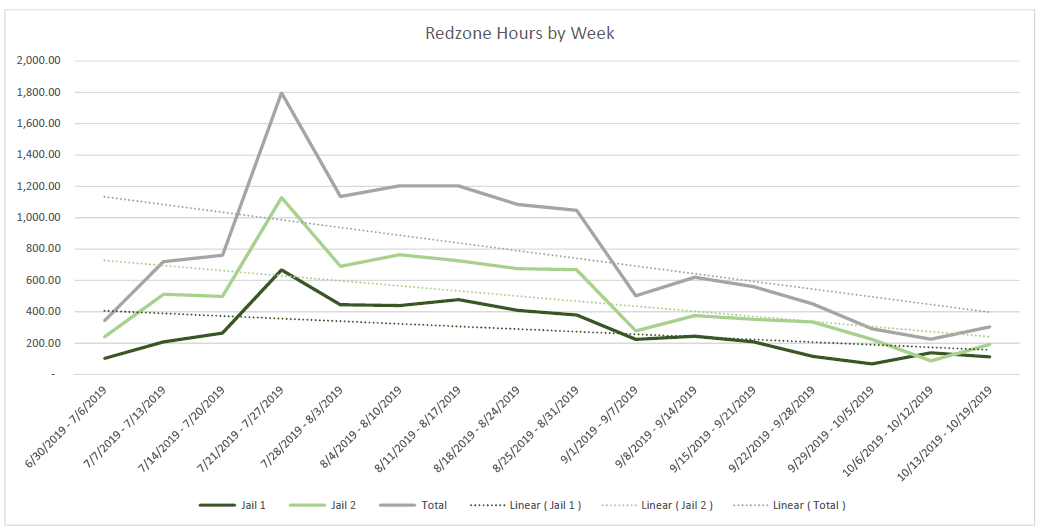
Data are averaged on a monthly basis due to system limitations that prohibit reporting on a smaller time frame. However, data show redzoning occurs 2-5 times more on Saturdays and Sundays than on weekdays. The months with five weekends (March and June) have higher averages than those months with only four weekends. The image including weekly data shows the total hours redzoning was used per week from Sunday - Saturday, starting with the first full week in January.
Monthly data are reported by the Cuyahoga County Office of Innovation and Performance on a quarterly basis.
Why is this important? |
The safety and well-being of those incarcerated in the Cuyahoga County Corrections Center are of utmost importance. While redzoning may be required during staffing shortages to maintain the safety and security of the facility, it should be of a limited nature. Tracking data on the use of redzoning enables County staff to identify trends that can assist in the development of strategic solutions to reduce and virtually eliminate redzoning.
How are we making an impact? | |
Steps are being taken to increase staffing levels at the Cuyahoga County Corrections Center. In 2019, Cuyahoga County Council approved spending to hire an additional 60 corrections officers to fill staff shortages at the jail. An increase in the starting salary for corrections officers was also approved. The County has expanded efforts to recruit corrections officers, deputy sheriffs, and security officers, including by engaging local colleges and universities and hosting job fairs. These recruitment efforts were ongoing during the third quarter of 2019 and have contributed to the reduction of redzoning.
The Sheriff's Department has re-evaluated work posts and made adjustments in an attempt to provide more corrections officers in housing units. Corrections officers are now receiving more intensive on-the-job training, which allows them to work independently in support positions. Officers cleared to work independently are being assigned to work an adjusted eight-hour schedule (Sunday through Thursday or Tuesday through Saturday) to assist with weekend coverage.
Data Source |
Cuyahoga County Sheriff's Department
Redzoning Average Hours Per Day - Weekly Performance | |
Redzoning Average Hours Per Day - Monthly Performance |
Redzoning Average Hours Per Day Per Pod - Monthly Performance |
Measure Data |
| Period |  | Status | Average Hours Per Day - Jail 1 | Average Hours Per Day - Jail 2 | Average Hours Per Day - Total | Number of Pods - Jail 1 | Number of Pods - Jail 2 | Average Hours Per Day Per Pod - Jail 1 | Average Hours Per Day Per Pod - Jail 2 |
|---|---|---|---|---|---|---|---|---|---|
| Jan-17 | | Not Defined | |||||||
| Feb-17 | | Not Defined | |||||||
| Mar-17 | | Not Defined | |||||||
| Apr-17 | | Not Defined | |||||||
| May-17 | | Not Defined | |||||||
| Jun-17 | | Not Defined | |||||||
| Jul-17 | | Not Defined | |||||||
| Aug-17 | | Not Defined | |||||||
| Sep-17 | | Not Defined | |||||||
| Oct-17 | | Not Defined | |||||||
| Nov-17 | | Not Defined | |||||||
| Dec-17 | | Not Defined | |||||||
| Jan-18 | | Not Defined | |||||||
| Feb-18 | | Not Defined | |||||||
| Mar-18 | | Not Defined | |||||||
| Apr-18 | | Not Defined | |||||||
| May-18 | | Not Defined | |||||||
| Jun-18 | | Not Defined | |||||||
| Jul-18 | | Not Defined | |||||||
| Aug-18 | | Not Defined | |||||||
| Sep-18 | | Not Defined | |||||||
| Oct-18 | | Not Defined | |||||||
| Nov-18 | | Not Defined | |||||||
| Dec-18 | | Not Defined | |||||||
| Jan-19 | | In Progress | 45.50 | 80.50 | 126.00 | 24.00 | 24.00 | 1.90 | 3.35 |
| Feb-19 | | In Progress | 56.00 | 91.90 | 147.90 | 24.00 | 24.00 | 2.33 | 3.83 |
| Mar-19 | | In Progress | 56.40 | 96.00 | 152.40 | 24.00 | 24.00 | 2.35 | 4.00 |
| Apr-19 | | In Progress | 38.60 | 56.10 | 94.70 | 24.00 | 24.00 | 1.61 | 2.34 |
| May-19 | | In Progress | 27.20 | 40.20 | 67.40 | 24.00 | 24.00 | 1.13 | 1.68 |
| Jun-19 | | In Progress | 36.20 | 50.30 | 86.50 | 24.00 | 24.00 | 1.51 | 2.10 |
| Jul-19 | | In Progress | 46.20 | 82.70 | 128.90 | 24.00 | 24.00 | 1.93 | 3.45 |
| Aug-19 | | In Progress | 61.00 | 104.00 | 165.00 | 24.00 | 24.00 | 2.54 | 4.33 |
| Sep-19 | | In Progress | 27.20 | 46.30 | 73.50 | 24.00 | 24.00 | 1.13 | 1.93 |
| Oct-19 | | Not Defined | |||||||
| Nov-19 | | Not Defined | |||||||
| Dec-19 | | Not Defined |